|
TABLE OF CONTENTS HIGHLIGHTS INTRODUCTION HCUP PARTNERS 1. OVERVIEW 2. DIAGNOSES 3. PROCEDURES 4. COSTS 5. WOMEN'S HEALTH SOURCES/METHODS DEFINITIONS FOR MORE INFO ACKNOWLEDGMENTS CITATION FACTS & FIGURES 2009 PDF |
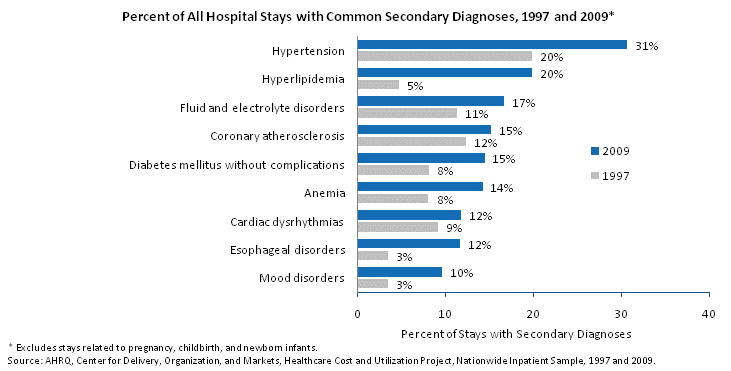
EXHIBIT 2.3 Most Frequent Secondary Diagnoses (PDF)
Percent of all hospital stays with common secondary diagnoses, 1997 and 2009. Bar chart. Percent of stays with secondary diagnoses. Hypertension: 1997: 20%; 2009: 31%; hyperlipidemia: 1997: 5%; 2009: 20%; fluid and electrolyte disorders: 1997: 11%; 2009: 17%; coronary atherosclerosis: 1997: 12%; 2009: 15%; diabetes mellitus without complications: 1997: 8%; 2009: 15%; anemia: 1997: 8%; 2009: 14%; cardiac dysrhythmias: 1997: 9%; 2009: 12%; esophageal disorders: 1997: 3%; 2009: 12%; mood disorders: 1997: 3%; 2009: 10%. Note: Excludes stays related to pregnancy, childbirth, and newborn infants. Source: AHRQ, Center for Delivery, Organization, and Markets, Healthcare Cost and Utilization Project, Nationwide Inpatient Sample, 1997 and 2009.
|

 Email Updates