TABLE OF CONTENTS
HIGHLIGHTS
INTRODUCTION
HCUP PARTNERS
1. OVERVIEW
2. DIAGNOSES
3. PROCEDURES
4. COSTS
5. WOMEN'S HEALTH
SOURCES/METHODS
DEFINITIONS
FOR MORE INFO
ACKNOWLEDGMENTS
CITATION
FACTS & FIGURES 2009 PDF
|
EXHIBIT 5.6 Childbirth (PDF)
5.6a
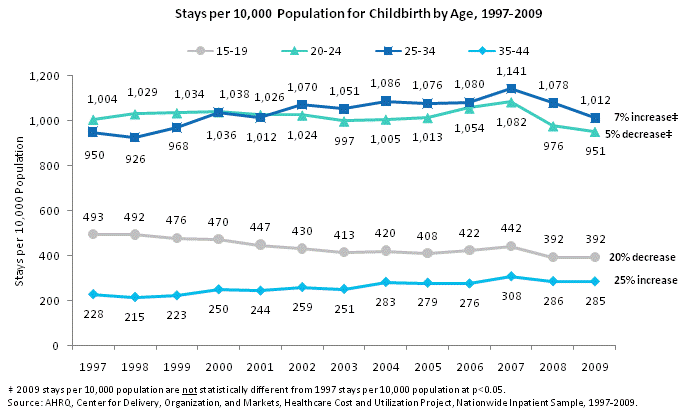
Stays per 10,000 population for childbirth by age, 1997 through 2009. Line chart. Stays per 10,000 population. 15 to 19. 20% decrease between 1997 and 2009. 1997: 493; 1998: 492; 1999: 476; 2000: 470; 2001: 447; 2002: 430; 2003: 413; 2004: 420; 2005: 408; 2006: 422; 2007: 442; 2008: 392; 2009: 392. 20-24. 5% decrease not statistically significant. 1997: 1,004; 1998: 1,029; 1999: 1,034; 2000: 1,038; 2001: 1,026; 2002: 1,024; 2003: 997; 2004: 1,005; 2005: 1,013; 2006: 1,054; 2007: 1,082; 2008: 976; 2009: 951. 25-34. 7% increase not statistically significant. 1997: 950; 1998: 926; 1999: 968; 2000: 1,036; 2001: 1,012; 2002: 1,070; 2003: 1,051; 2004: 1,086; 2005: 1,076; 2006: 1,080; 2007: 1,141; 2008: 1,078; 2009: 1,012. 35-44. 25% increase between 1997 and 2009. 1997: 228; 1998: 215; 1999: 223; 2000: 250; 2001: 244; 2002: 259; 2003: 251; 2004: 283; 2005: 279; 2006: 276; 2007: 308; 2008: 286; 2009: 285. Source: AHRQ, Center for Delivery, Organization, and Markets, Healthcare Cost and Utilization Project, Nationwide Inpatient Sample, 1997-2009.
- The highest rate of hospital stays for childbirth was among 20 to 24 and 25 to 34 year olds. Between 1997 and 2009, the rate of births was similar for these age groups.
- The birthrate among 20 to 24 year olds remained stable between 1997 and 2007 and then declined 14 percent to 951 births per 10,000 females in 2009.
- The birthrate among 25 to 34 year olds increased 20 percent from 950 births per 10,000 females in 1997 to 1,141 births per 10,000 females in 2007, and then decreased 13 percent to 1,012 births per 10,000 females in 2009.
- Among 15 to 19 year olds, the rate of births decreased from 493 stays per 10,000 females in 1997 to 392 stays per 10,000 females in 2009, a 20-percent decrease over the time period.
- For those aged 35 to 44 years, the birthrate increased by 25 percent between 1997 and 2009. There were 228 births per 10,000 females in 1997 and 285 births per 10,000 females in 2009.
5.6b
Number of Stays and Stays per 1,000 Maternal Stays for the Most Frequent Principal Diagnoses for Maternal Hospital Stays, 1997 and 2009
| PRINCIPAL CCS DIAGNOSIS |
NUMBER OF STAYS IN THOUSANDS |
STAYS PER 1,000 MATERNAL STAYS |
| 1997 |
2009 |
1997 |
2009 |
| All maternal stays† |
4,333 |
4,568 |
1,000 |
1,000 |
| Trauma to vulva and perineum due to childbirth |
710 |
748 |
164 |
164 |
| Maternal stay with previous C-section |
271 |
540 |
63 |
118ξ |
| Prolonged pregnancy |
104 |
275 |
24 |
60ξ |
| Normal pregnancy and/or delivery |
536 |
261 |
124 |
57ξ |
| Hypertension complicating pregnancy, childbirth and the puerperium |
184 |
235 |
42 |
51ξ |
| Fetal distress and abnormal forces of labor |
418 |
219 |
97 |
48ξ |
| Early or threatened labor |
260 |
197 |
60 |
43ξ |
| Umbilical cord complication |
258 |
194 |
60 |
42ξ |
| Polyhydramnios and other problems of amniotic cavity |
201 |
179 |
47 |
39ξ |
| Malposition, malpresentation |
161 |
160 |
37 |
35 |
† Includes additional maternal CCS diagnoses not shown on this table but listed in the Sources and Methods of this report.
ξ 2009 stays per 1,000 maternal stays are statistically different from 1997 stays per 1,000 maternal stays at p<0.05.
Source: AHRQ, Center for Delivery, Organization, and Markets, Healthcare Cost and Utilization Project, Nationwide Inpatient Sample, 1997 and 2009.
|
- There were 4.6 million maternal stays in 2009.
- Trauma to vulva and perineum due to childbirth was the most common condition in both 1997 and 2009 and the rate of this condition was similar between years.
- The following maternal conditions increased from 1997 to 2009:
- Maternal stay with previous C-section
- Prolonged pregnancy
- Hypertension complication pregnancy, childbirth and the puerperium
- The following maternal conditions decreased from 1997 to 2009:
- Normal pregnancy and/or delivery
- Fetal distress and abnormal forces of labor
- Early or threatened labor
- Umbilical cord complication
- Polyhydramnios and other problems of amniotic cavity
- Maternal stay with previous C-section rose in rank from fourth in 1997 to second in 2009.
- The number of stays for normal pregnancy decreased from 124 per 1,000 maternal stays in 1997 to 57 per 1,000 maternal stays in 2009. Normal pregnancies are defined as vaginal births with no complicating conditions.
5.6c
Number of Stays and Stays per 1,000 Maternal Stays for the Most Frequent All-listed Procedures for Maternal Hospital Stays, 1997 and 2009
| ALL-LISTED CCS PROCEDURES |
NUMBER OF STAYS WITH THE PROCEDURE IN THOUSANDS |
PROCEDURES PER 1,000 MATERNAL STAYS |
| 1997 |
2009 |
1997 |
2009 |
| All maternal stays (with procedures) |
3,965 |
4,266 |
915 |
934 |
| Cesarean section |
797 |
1,375 |
184 |
301ξ |
| Repair of obstetric laceration |
1,133 |
1,339 |
261 |
293ξ |
| Artificial rupture of membranes to assist delivery |
850 |
929 |
196 |
203 |
| Fetal monitoring |
997 |
855 |
230 |
187 |
| Episiotomy |
863 |
315 |
199 |
69ξ |
| Ligation or occlusion of fallopian tubes |
304 |
287 |
70 |
63 |
| Forceps, vacuum, and breech delivery |
426 |
276 |
98 |
60ξ |
| Insertion of catheter or spinal stimulator and injection into spinal canal |
124 |
190 |
29 |
42 |
| Prophylactic vaccinations and inoculations |
14 |
77 |
3 |
17ξ |
| Blood transfusion |
18 |
58 |
4 |
13ξ |
ξ 2009 stays per 1,000 maternal stays are statistically different from 1997 stays per 1,000 maternal stays at p< 0.05.
Source: AHRQ, Center for Delivery, Organization, and Markets, Healthcare Cost and Utilization Project, Nationwide Inpatient Sample, 1997 and 2009.
|
- Repair of obstetric laceration and C-section were the most common maternal procedures in 1997 and 2009.
- There were 261 procedures for repair of obstetric laceration per 1,000 maternal stays in 1997 and 293 procedures per 1,000 maternal stays in 2009.
- C-section, which was the fifth ranked maternal procedure in 1997, rose to the first ranked in 2009, occurring at a rate of 301 procedures per 1,000 maternal stays in 2009.
- The rate of episiotomies decreased 65 percent from 199 procedures per 1,000 maternal stays in 1997 to 69 procedures per 1,000 maternal stays in 2009.
5.6d
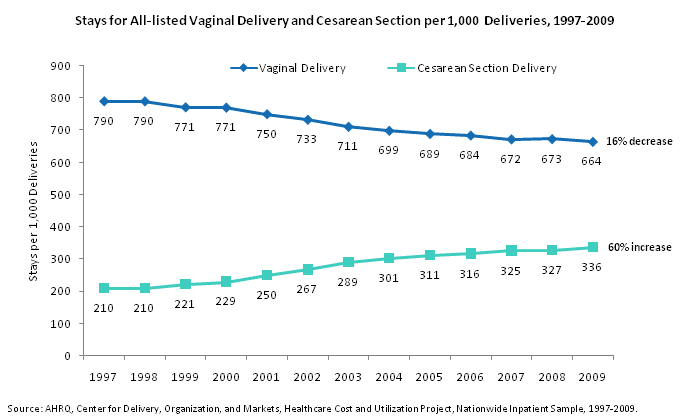
Stays for all-listed vaginal delivery and Cesarean section per 1,000 deliveries, 1997 through 2009. Line chart. Stays per 1,000 deliveries. Vaginal delivery. 16% decrease between 1997 and 2009. 1997: 790; 1998: 790; 1999: 771; 2000: 771; 2001: 750; 2002: 733; 2003: 711; 2004: 699; 2005: 689; 2006: 684; 2007: 672; 2008: 673; 2009: 664. Cesarean section delivery. 60% increase between 1997 and 2009. 1997: 210; 1998: 210; 1999: 221; 2000: 229; 2001: 250; 2002: 267; 2003: 289; 2004: 301; 2005: 311; 2006: 316; 2007: 325; 2008: 327; 2009: 336. Source: AHRQ, Center for Delivery, Organization, and Markets, Healthcare Cost and Utilization Project, Nationwide Inpatient Sample, 1997-2009.
- The rate of vaginal deliveries decreased by 16 percent, from 790 stays per 1,000 deliveries in 1997 to 664 stays per 1,000 deliveries in 2009.
- The rate of C-sections increased by 60 percent between 1997 and 2009. There were 210 C-sections performed per 1,000 deliveries in 1997 and 336 per 1,000 deliveries in 2009.
5.6e 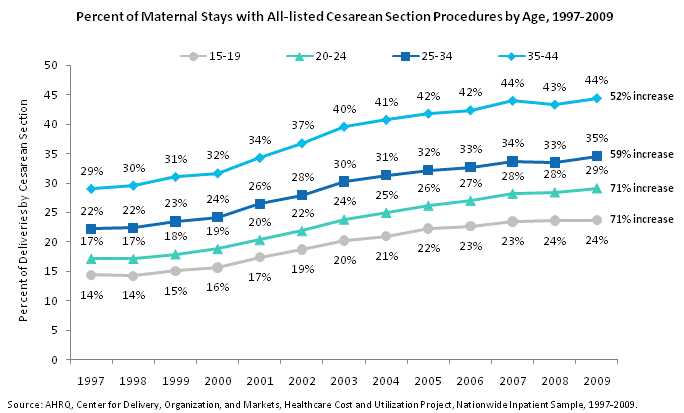
Percent of maternal stays with all-listed Cesarean section procedures by age, 1997 through 2009. Line chart. Percent of deliveries by Cesarean section. 15 to 19. 71% increase between 1997 and 2009. 1997: 14%; 1998: 14%; 1999: 15%; 2000: 16%; 2001: 17%; 2002: 19%; 2003: 20%; 2004: 21%; 2005: 22%; 2006: 23%; 2007: 23%; 2008: 24%; 2009: 24%. 20-24. 71% increase between 1997 and 2009. 1997: 17%; 1998: 17%; 1999: 18%; 2000: 19%; 2001: 20%; 2002: 22%; 2003: 24%; 2004: 25%; 2005: 26%; 2006: 27%; 2007: 28%; 2008: 28%; 2009: 29%. 25-34. 59% increase between 1997 and 2009. 1997: 22%; 1998: 22%; 1999: 23%; 2000: 24%; 2001: 26%; 2002: 28%; 2003: 30%; 2004: 31%; 2005: 32%; 2006: 33%; 2007: 34%; 2008: 33%; 2009: 35%. 35-44. 52% increase between 1997 and 2009. 1997: 29%; 1998: 30%; 1999: 31%; 2000: 32%; 2001: 34%; 2002: 37%; 2003: 40%; 2004: 41%; 2005: 42%; 2006: 42%; 2007: 44%; 2008: 43%; 2009: 44%. Source: AHRQ, Center for Delivery, Organization, and Markets, Healthcare Cost and Utilization Project, Nationwide Inpatient Sample, 1997-2009.
- In 2009, the percent of deliveries via C-section was highest among 35 to 44 year olds (44 percent). This represents a 52-percent increase from 1997.
- Among 25 to 34 year olds, the percent of maternal deliveries with a C-section grew to 35 percent in 2009 from 22 percent in 1997, a 59-percent increase since 1997.
- The largest increases were seen in the youngest age groups (15 to 19 and 20 to 24 year olds) for whom the C-section rate grew by 71 percent between 1997 and 2009.
5.6f
Stays for all-listed vaginal deliveries with and without episiotomy and perineal lacerations per 1,000 deliveries, 1997 through 2009. Line chart. Stays per 1,000 deliveries. Vaginal delivery without episiotomy. 4% increase between 1997 and 2009 not statistically significant. 1997: 564; 1998: 583; 1999: 578; 2000: 589; 2001: 582; 2002: 584; 2003: 572; 2004: 576; 2005: 584; 2006: 592; 2007: 588; 2008: 591; 2009: 588. Perineal lacerations. 9% increase between 1997 and 2009 not statistically significant. 1997: 303; 1998: 309; 1999: 308; 2000: 324; 2001: 316; 2002: 320; 2003: 309; 2004: 317; 2005: 318; 2006: 324; 2007: 320; 2008: 330; 2009: 329. Vaginal delivery with episiotomy. 66% decrease between 1997 and 2009. 1997: 227; 1998: 207; 1999: 201; 2000: 182; 2001: 168; 2002: 149; 2003: 139; 2004: 122; 2005: 105; 2006: 92; 2007: 84; 2008: 82; 2009: 77. Source: AHRQ, Center for Delivery, Organization, and Markets, Healthcare Cost and Utilization Project, Nationwide Inpatient Sample, 1997-2009.
- The rate of vaginal delivery without episiotomy remained relatively stable from 1997 to 2009.
- From 1997 to 2009, the rate of perineal lacerations also remained stable.
- The rate of vaginal delivery with episiotomy decreased 66 percent — from 227 stays per 1,000 deliveries in 1997 to 77 stays per 1,000 deliveries in 2009.
5.6g
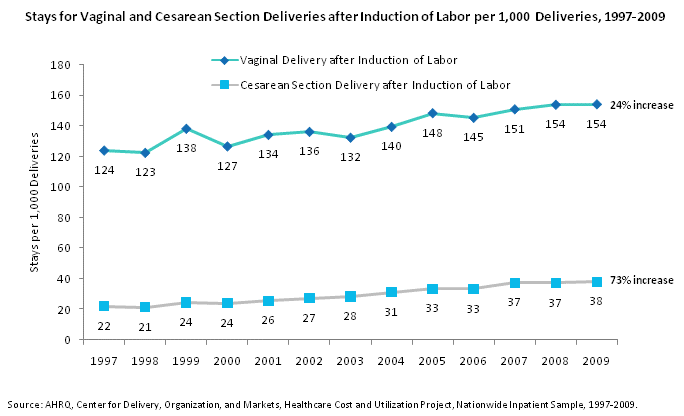
Stays for vaginal and Cesarean section deliveries after induction of labor per 1,000 deliveries, 1997 through 2009. Line chart. Stays per 1,000 deliveries. Vaginal delivery after induction of labor. 24% increase between 1997 and 2009. 1997: 124; 1998: 123; 1999: 138; 2000: 127; 2001: 134; 2002: 136; 2003: 132; 2004: 140; 2005: 148; 2006: 145; 2007: 151; 2008: 154; 2009: 154. Cesarean section delivery after induction of labor. 73% increase between 1997 and 2009. 1997: 22; 1998: 21; 1999: 24; 2000: 24; 2001: 26; 2002: 27; 2003: 28; 2004: 31; 2005: 33; 2006: 33; 2007: 37; 2008: 37; 2009: 38. Source: AHRQ, Center for Delivery, Organization, and Markets, Healthcare Cost and Utilization Project, Nationwide Inpatient Sample, 1997-2009.
- The rate of vaginal deliveries after induction of labor increased by 24 percent from 124 per 1,000 deliveries in 1997 to 154 in 2009.
- From 1997 to 2009, the rate of C-sections after induction of labor increased by 73 percent from 22 to 38 per 1,000 deliveries.
5.6h
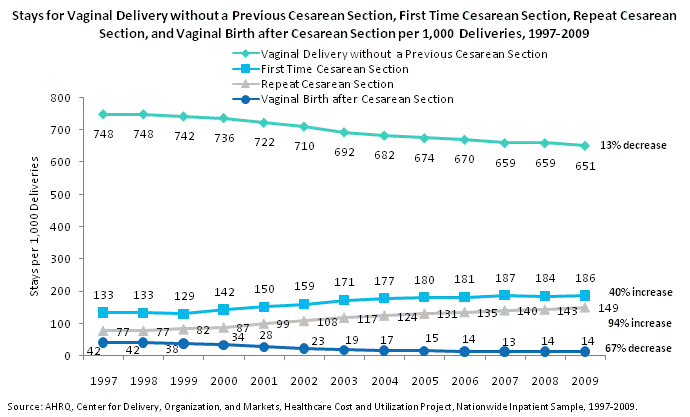
Stays for vaginal delivery without a previous Cesarean section, first time Cesarean section, repeat Cesarean section, and vaginal birth after Cesarean section per 1,000 deliveries, 1997 through 2009. Line chart. Stays per 1,000 deliveries. Vaginal delivery without a previous Cesarean section. 13% decrease between 1997 and 2009. 1997: 748; 1998: 748; 1999: 742; 2000: 736; 2001: 722; 2002: 710; 2003: 692; 2004: 682; 2005: 674; 2006: 670; 2007: 659; 2008: 659; 2009: 651. First time Cesarean section. 40% increase between 1997 and 2009. 1997: 133; 1998: 133; 1999: 129; 2000: 142; 2001: 150; 2002: 159; 2003: 171; 2004: 177; 2005: 180; 2006: 181; 2007: 187; 2008: 184; 2009: 186. Repeat Cesarean section. 94% increase between 1997 and 2009. 1997: 77; 1998: 77; 1999: 82; 2000: 87; 2001: 99; 2002: 108; 2003: 117; 2004: 124; 2005: 131; 2006: 135; 2007: 140; 2008: 143; 2009: 149. Vaginal birth after Cesarean section. 67% decrease between 1997 and 2009. 1997: 42; 1998: 42; 1999: 38; 2000: 34; 2001: 28; 2002: 23; 2003: 19; 2004: 17; 2005: 15; 2006: 14; 2007: 13; 2008: 14; 2009: 14. Source: AHRQ, Center for Delivery, Organization, and Markets, Healthcare Cost and Utilization Project, Nationwide Inpatient Sample, 1997-2009.
- The rate of vaginal delivery without a previous C-section decreased by 13 percent from 748 per 1,000 deliveries in 1997 to 651 per 1,000 deliveries in 2009.
- Between 1997 and 2009, first time C-section rates increased by 40 percent from 133 procedures per 1,000 deliveries in 1997 to 186 procedures per 1,000 deliveries in 2009.
- Between 1997 and 2009, the rate of repeat C-sections grew by 94 percent from 77 previous C-sections per 1,000 deliveries in 1997 to 149 per 1,000 deliveries in 2009.
- Vaginal births after C-sections declined 67 percent between 1997 and 2009 from 42 stays per 1,000 deliveries to 14 stays per 1,000 deliveries.
Previous Next
|




 Email Updates